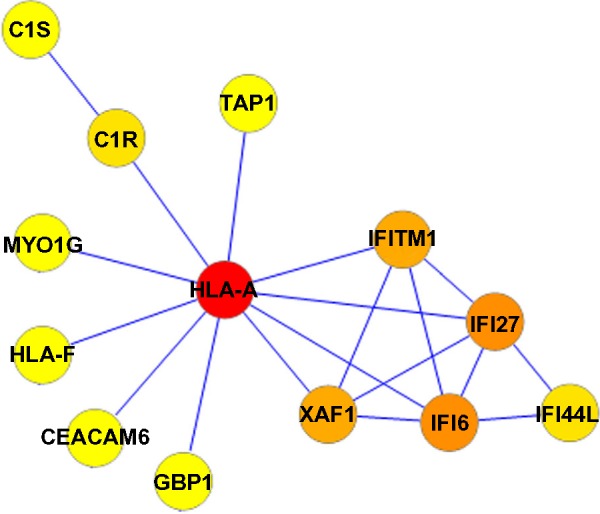
Figure 2.

Protein–protein interaction network in COPD patients. Nodes with colors from yellow to red represent different degrees. The lowest degree, 1, is represented by yellow and the highest degree, 10, by red.
Abbreviation: COPD, chronic obstructive pulmonary disease.
