
Figure 1.
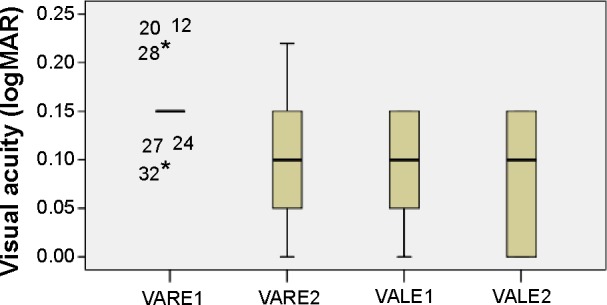
VA distribution.
Notes: Boxplots of VA (logMAR) mean values for each eye at the first and second visits.
Abbreviations: logMAR, log minimum angle of resolution; VA, visual acuity; VALE1 and 2, VA of left eye at first and second visits, respectively; VARE1 and 2, VA of right eye at first and second visits, respectively.