Fig. 5.

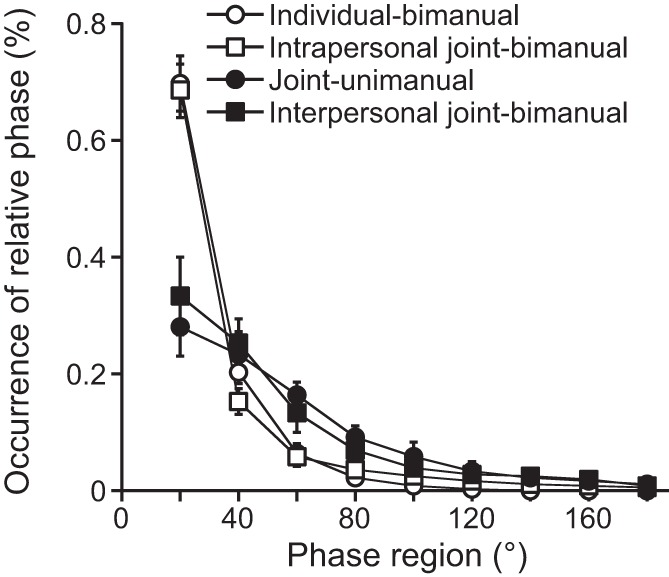
Distribution of relative phase angles as a function of the 9, 20° regions of relative phase (i.e., 0–20°, 21–40°, 41–60°, . . ., 161–180°) for 4 conditions. Error bars show the between-participants SE.

Distribution of relative phase angles as a function of the 9, 20° regions of relative phase (i.e., 0–20°, 21–40°, 41–60°, . . ., 161–180°) for 4 conditions. Error bars show the between-participants SE.