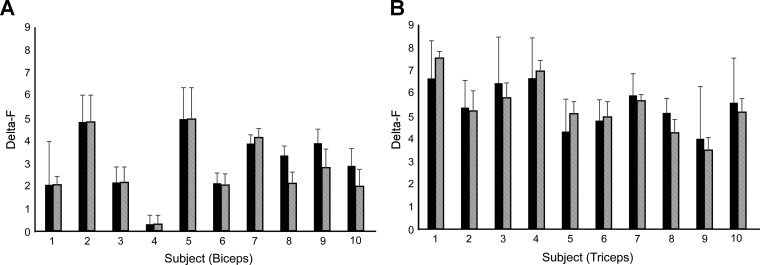
Fig. 2.
Average ΔF for each subject in biceps (A) and triceps (B). Black bars denote ΔF with motor unit pairs showing a coefficient of determination >0.7; hatched bars denote ΔF with the same criteria after removal of unit pairs that show possible saturation of the control unit. There were no significant changes in average ΔF when controlling for saturation in biceps (P = 0.6) or triceps (P = 0.9) compared with the first criterion. Error bars denote SE.

