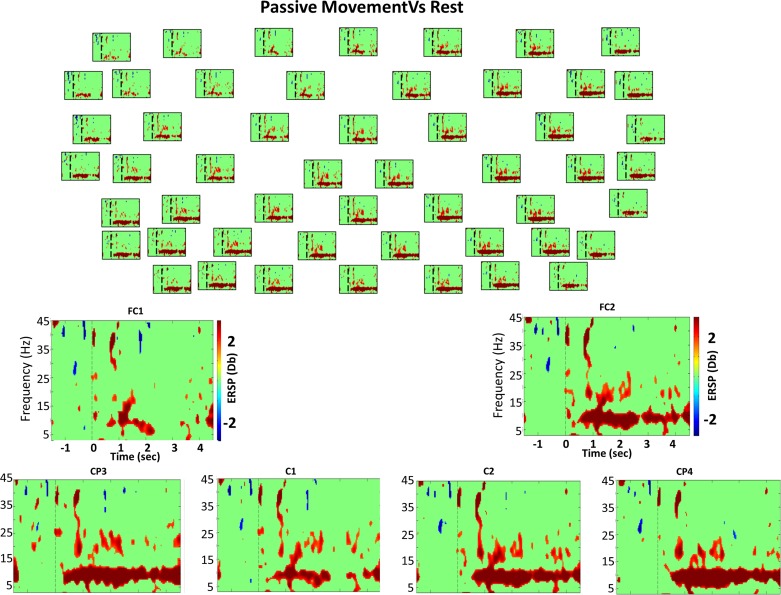
Fig. 5.
Bootstrap analysis (grand average) comparing passive movement and rest. Top: bootstrap analysis (grand average) comparing the passive movement task and rest of 52 electrodes from the 61 used (for clarity, 9 electrodes were excluded from the figure). Everything not in green is statistically significant (P < 0.01). The vertical dashed line indicates the time in which the GO cue was presented. Red color indicates DS (power decrease in dB), and blue shows S (power increase in dB) during passive compared with EEG activity during the rest condition, as expressed in the color bar. Bottom: enlarged views of different channels of time-frequency power difference between these 2 classes.

