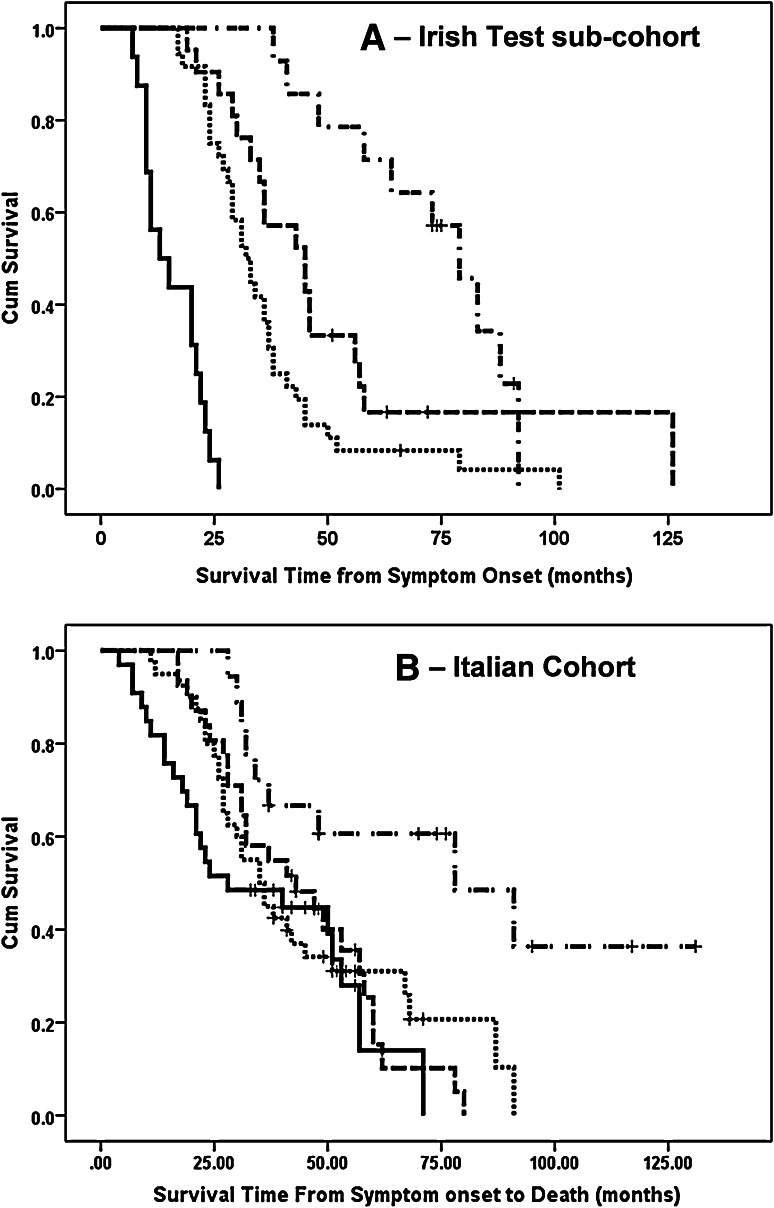
Fig. 4.
Figure shows Kaplan–Meier plots for survival probabilities in the Irish test cohort (a) and Italian cohort (b). In all cases ALS patients were stratified by ALSFRS-R slope only. Solid line ALSFRS-R slope of 1.0 points/month or more, dotted line ALSFRS-R slope 0.50–0.99 points/month, dashed line ALSFRS-R slope 0.25–0.49 points/month, dash and dot line ALSFRS-R slope <0.25 points/month

