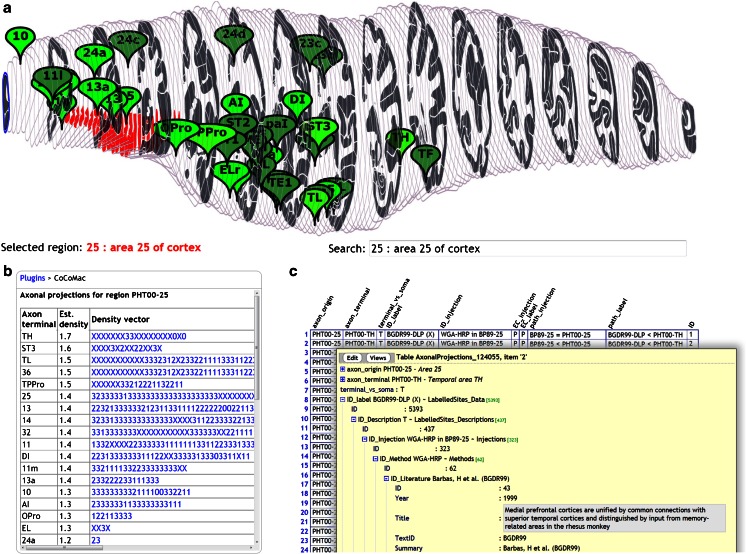
Fig. 6.
Output of the CoCoMac plugin: a the axonal projections of region PHT00-25 are displayed as markers with a color intensity that represents connection strength. Note that this strength measure is not an official CoCoMac variable, it is provided to display capabilities of the SBA; b tabular output, in which each connection is represented by a character string. Each character is a separate ‘piece of evidence’, whereby X,0,1,2,3 mean unknown strength, absent, weak, medium and strong tracer labelling, respectively; c Interactive tabular display at the CoCoMac.g-node.org website allows traceback to the original publication

