
Fig. 1.
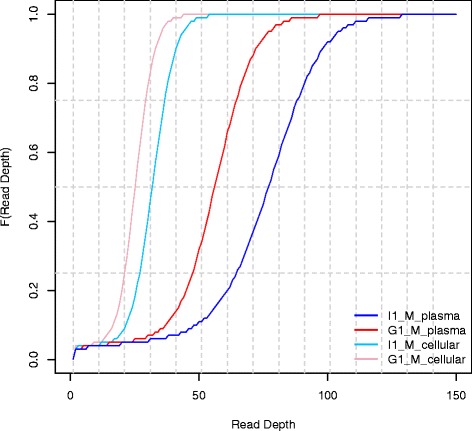
Empirical cumulative distribution functions of per-base read coverage for matched cell-free DNA and cellular samples. The two cfDNA datasets are named I1_M_plasma and G1_M_plasma while the cellular DNA from the matched subjects are named I1_M_cellular and G1_M_cellular