
Fig. 2.
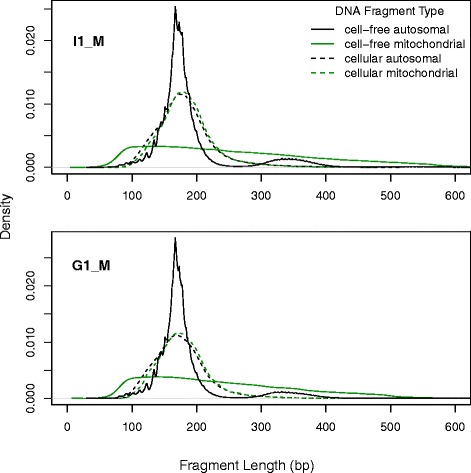
Size distributions of cell-free DNA contrasted with cellular DNA for two subjects (I1_M and G1_M). Fragments are divided into autosomal and mitochondrial classes and fragment sizes are calculated using the paired-positioning of sequencing reads