
Fig. 5.
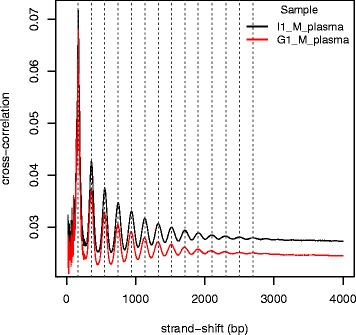
Strand cross-correlation analysis for cell-free DNA. The 3′ strand is shifted with respect to the forward strand in increments of 1 bp and the Pearson’s correlation between the per-position read counts for each strand is calculated to generate this cross-correlation plot