
Fig. 6.
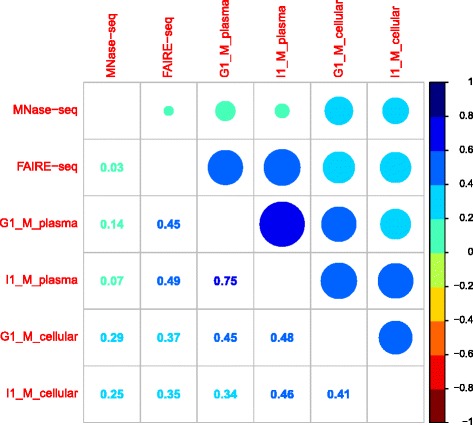
Pearson’s correlation of cell-free and cellular DNA read coverage signal with open/closed chromatin enrichment annotation. Pairwise Pearson’s correlation is calculated between fragment start site signal tracks from cell-free and cellular DNA sequencing data along with open chromatin (FAIRE-seq) and nucleosomal position (MNase-seq) signal annotation from ENCODE. The figure provides the pictorial representation of the resulting correlation matrix