
Fig. 7.
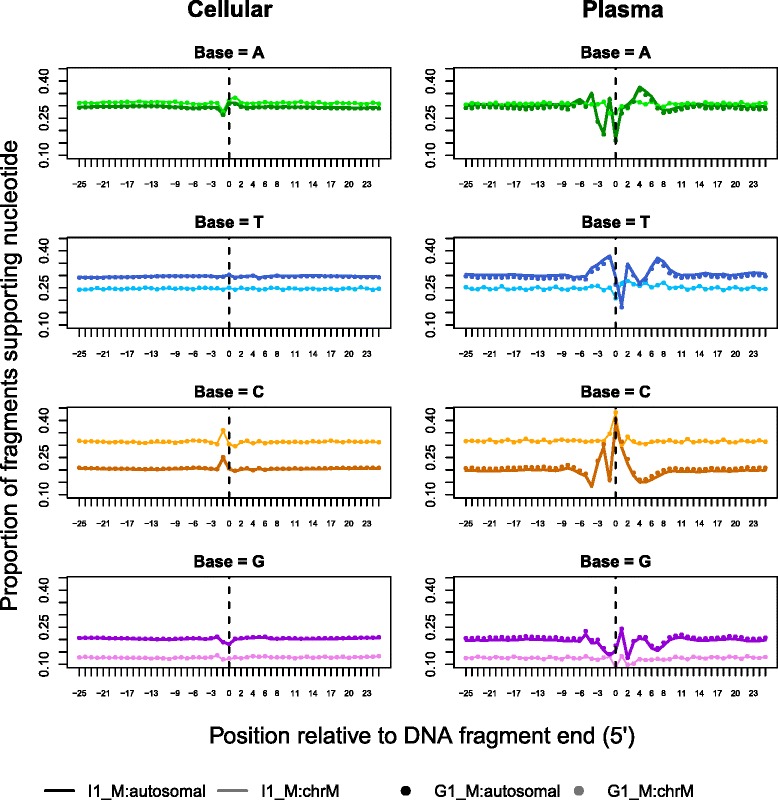
Mononucleotide frequencies for the region of 51 bp (+/−25 bp) around fragment start sites. The y-axis denotes the proportion of each nucleotide at fixed positions relative to the 5′ end of the DNA fragment and the vertical line at 0 denotes the fragment start. Sample I1_M is denoted with lines while circles represent the G1_M values. For both cellular and cell-free data in the two samples, fragments are divided into autosomal and mitochondrial classes displayed in dark and light colors for each base respectively