
Fig. 9.
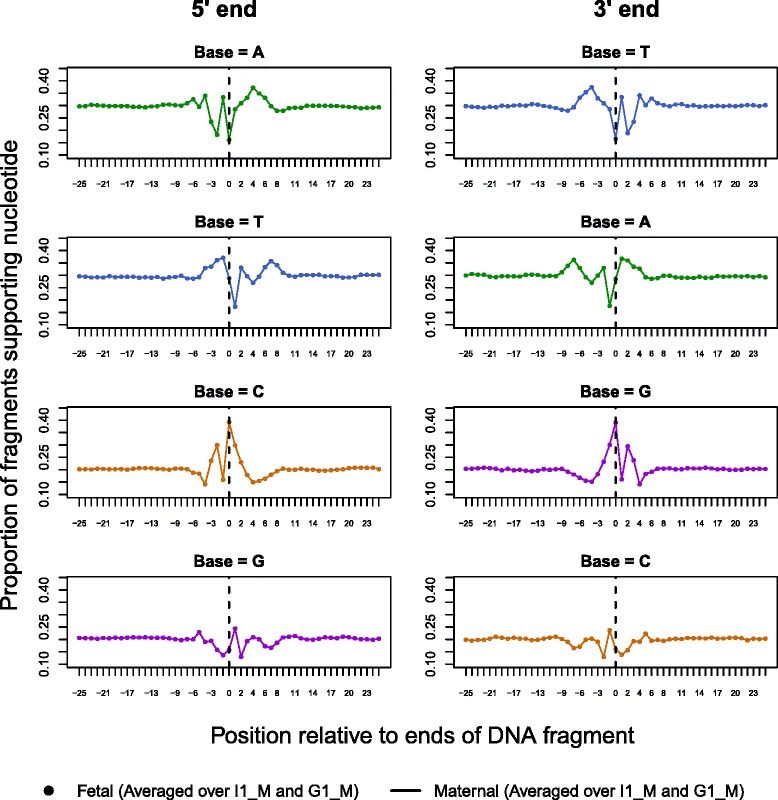
Comparison of the nucleotide signature at fragmentation sites for fetal and maternal fragments. This plot illustrates the mononucleotide frequencies for the region of 51 bp (+/−25 bp) around fragment starts and ends. The y-axis denotes the proportion of each nucleotide at fixed positions relative to the 5′ and 3′ ends of the DNA fragment and the vertical line at 0 denotes the strand specific fragment end. Maternal proportions per position are connected with lines while circles represent the fetal values. For both components, the proportions have been averaged over I1_M and G1_M. The close overlay of the fetal proportions and maternal values show that the variability between them is nearly negligible