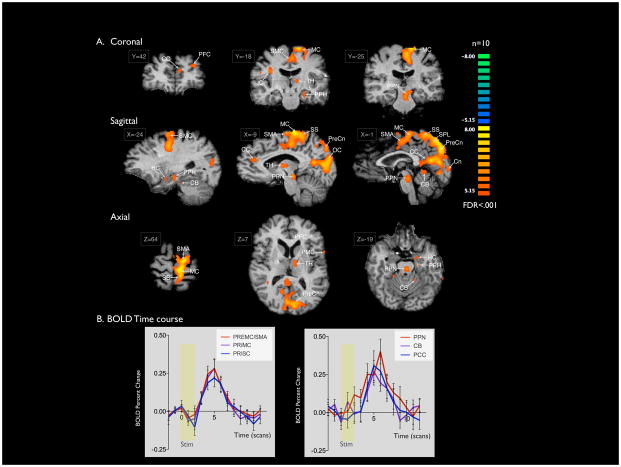
Figure 2. BOLD signal activation with STN DBS (2V 130–185Hz 90μs) for PD.
A) Areas of activation with unilateral STN stimulation at 2V 130–185Hz 90μs (n = 10) for PD. Slice Locations are presented in Talairach coordinates. Significant activation (FDR<.001) was observed in bilateral premotor and primary motor cortices, precuneus, occipital lobes, cerebellum, and anterior and posterior cingulate. Activation of ipsilateral thalamus, pedunculopontine nucleus, parahippocampal gyrus, and hippocampus, and contralateral insula were also observed. B) The average time courses for five regions of interest were plotted as average percent change in BOLD signal from baseline vs. time (one scan is equal to TR = 3 seconds) using ten frames (30 seconds) prior to stimulation (yellow box) as the baseline.

