Figure 2.

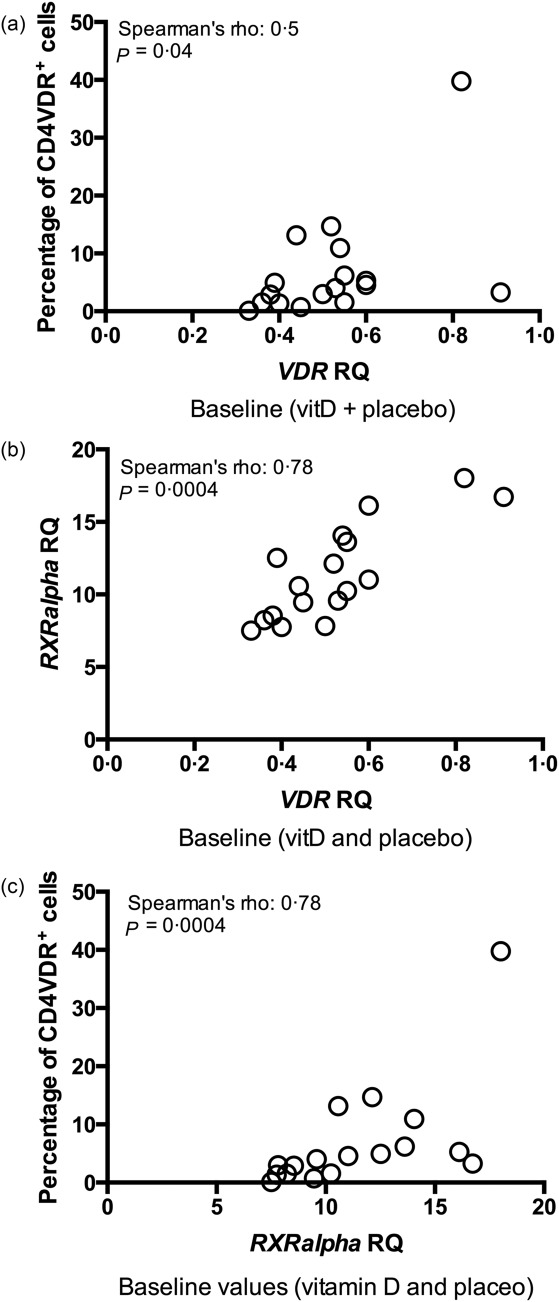
Correlations between flow cytometry and mRNA levels. (a) Baseline association between the percentage of flow cytometry CD4+ vitamin D receptor response (VDR)+ T cells and mRNA VDR expression in CD4+ T cells, including both the vitamin D and placebo group (n = 17; data are missing from one vitamin D-treated patient). VDR mRNA is measured as relative quantification (RQ). Cells for VDR expression measurement [flow cytometry and polymerase chain reaction (PCR)] were unstimulated. VitD = vitamin D-treated patients; placebo = placebo-treated patients. (b) Baseline correlation between mRNA RXRα RQ and mRNA VDR RQ in unstimulated CD4+ T cells at baseline (n = 17; data are missing from one vitD-treated patient). RXRα = retinoid X receptor alpha; VDR = vitamin D receptor. (c) Correlation between the percentage of CD4+VDR+ T cells and mRNA RXRα RQ in non-stimulated CD4+ T cells at baseline (n = 17; data are missing from one vitD-treated patient.
