
Figure 2.
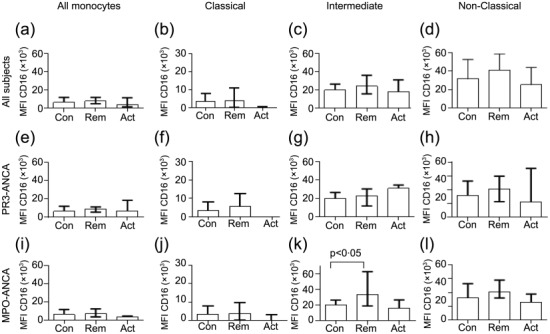
Median fluorescence intensity for CD16 in all monocytes and subsets. Blood monocytes (all monocytes, classical, intermediate and non-classical subsets) were analysed for CD16 expression by flow cytometry in all anti-neutrophil cytoplasm antibody (ANCA)-associated vasculitis (AAV) patients (a–d) or patients with proteinase 3 (PR3)-ANCA disease at diagnosis (e–h) or myeloperoxidase (MPO)-ANCA disease (i–l) (see Methods). (a–d) Monocytes in all AAV patients (n = 21 controls, 46 remission, 14 active); (e–h) monocytes in PR3-ANCA patients (n = 21 controls, 25 remission and seven active); i–l) monocytes in MPO-ANCA patients (n = 21 control, 21 remission and seven active). Differences were not statistically significant by one-way analysis of variance (anova) (Kruskal–Wallis test) and post-test unless indicated otherwise. Bars represent the median ± interquartile range. Note change in y-axis scale for classical monocytes.