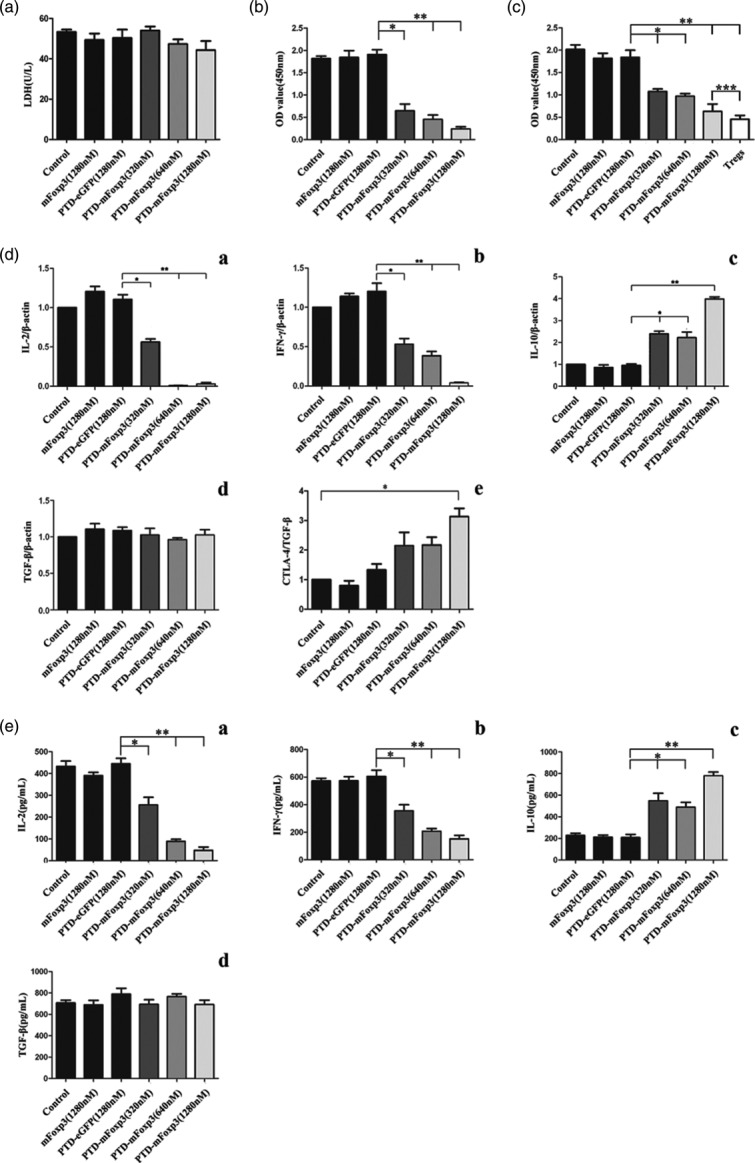
Figure 3.

Effect of fusion proteins on cell viabilities and proliferation in T cells. (a) Purified CD4+ T cells co-cultured with mitomycin C (MMC)-treated D2SC/1 along with ovalbumin (OVA)323–339 (2 μM), treated with or without mouse forkhead box protein 3 (mFoxP3), protein transduction domain (PTD)-enhanced green fluorescent protein (eGFP), PTD-mFoxP3 (320 nM, 640 nM, 1280 nM) for 24 h. Cell viabilities were measured by a lactate dehydrogenase activity (LDH) assay. Data are represented as the mean ± standard deviation (s.d.) of three independent experiments. (b) PTD-mFoxp3-treated CD4+CD25− T cells are hypoproliferative. After CD4+CD25− T cells were treated with PTD-mFoxP3, mFoxP3 or PTD-green fluorescent protein (GFP) for 1 h, cells were stimulated with OVA323–339 (2 μM) and MMC-treated D2SC/1 for 48 h, and cell proliferation was analysed by CCK-8. (c) PTD-mFoxP3 converts CD4+CD25− T cells to suppressor cells. A total of 5 × 10⁴ responder cells (CD4+CD25− T cells) were stimulated with OVA323–339 (2 μM) and MMC-treated D2SC/1 for 48 h with 5 × 10⁴ suppressor cells (PTD-mFoxpP3-, mFoxP3- or PTD-GFP-treated CD4+CD25− T cells). All cell proliferation was analysed by cell counting kit 8 (CCK-8). (d) PTD–mFoxP3 regulates cytokine and cytotoxic T lymphocyte antigen 4 (CTLA-4) expression at mRNA level from activated T cells. After CD4+CD25− T cells were treated with PTD-mFoxP3, mFoxP3 or PTD-GFP for 1 h, cells were stimulated with OVA323–339 (2 μM) and MMC-treated D2SC/1. Total RNA of 8 h-activated cells were extracted and examined for interleukin (IL)-2 and interferon (IFN)-γ, and 4-h-activated cells were for the examination of IL-10, transforming growth factor (TGF)-β and CTLA-4 expression. The ratio of the target gene versus β-actin at the control was set as 1. (e) PTD-mFoxP3 regulates cytokine secretion from activated T cells. After CD4+CD25− T cells were treated with PTD-mFoxP3, mFoxP3 or PTD-GFP for 1 h, cells were stimulated with OVA323–339 (2 μM) and MMC-treated D2SC/1 for 48 h. IL-2, IL-10, IFN-γ and TGF-β expression level in the same culture medium was analysed by enzyme-linked immunosorbent assay (ELISA). Data from three independent experiments are presented as mean ± standard deviation (s.d.), *P < 0·05 versus control; **P < 0·01 versus control.
