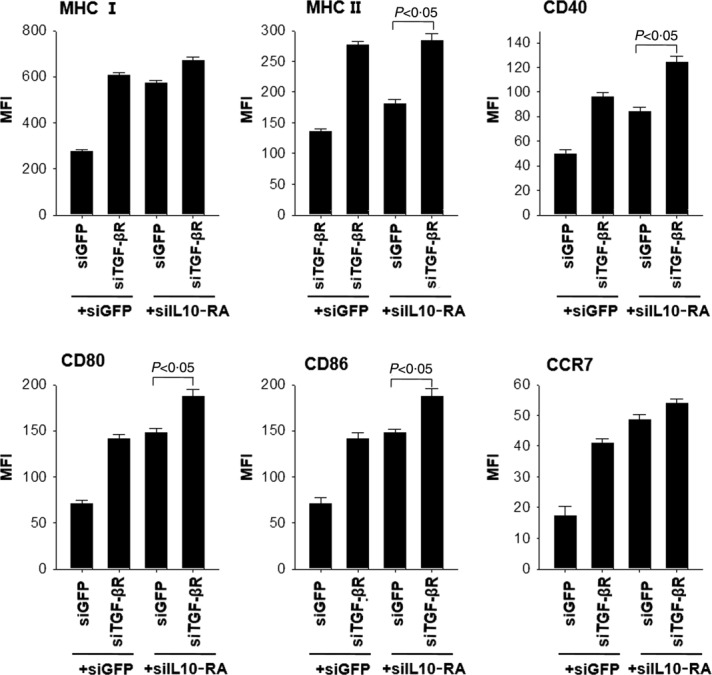
Figure 5.

Surface expression of CD40, CD80, CD86, major histocompatibility complex (MHC)-I, -II, and CCR7 on dendritic cells (DCs) transfected with small interfering RNA (siRNA) targeting green fluorescent protein (GFP), interleukin (IL)-10RA, transforming growth factor (TGF)-βR, or IL-10RA+TGF-βR. DCs transfected with siGFP, siIL-10RA, siTGF-β, or siIL-10RA+siTGF-βR were treated with 1 mg/ml lipopolysaccharide (LPS) for 18 h and then collected for analysis of expression of each molecule to characterize the maturation phenotypes. Bar graphs describing the mean fluorescence intensity (MFI) indicate MHC-I, -II, CD40, CD80, CD86 and CCR7 expression, respectively. The data presented in the figure are from one representative experiment out of three.
