
Fig. 2.
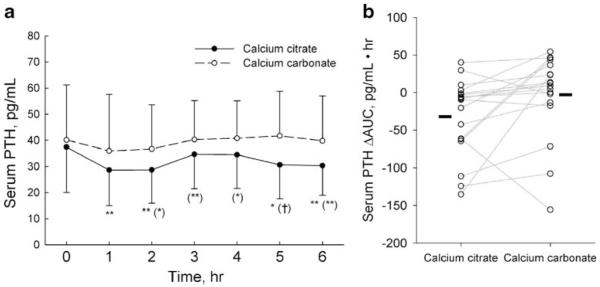
Serum PTH. a Data are presented as mean and standard deviation. The omnibus difference between the calcium supplements were statistically significant (p<0.0001, repeated measures analysis). *p<0.05, **p<0.01 vs. time 0; (*)p<0.05, (**)p<0.01, (†) p<0.001 vs. calcium carbonate. b Symbols and lines represent individual subjects. Solid bars indicate the mean ΔAUC of each phase