
Fig. 3.
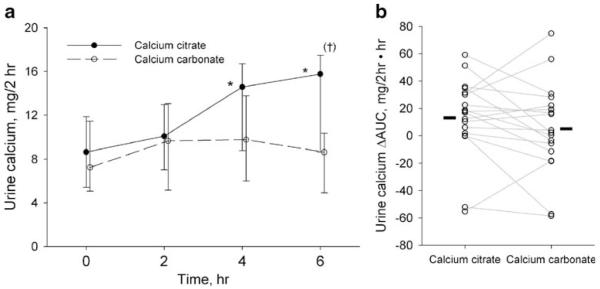
Urine calcium. a Data are presented as geometric mean and 95% confidence interval. *p=0.001 compared Time 0 within phase, (†)p=0.01 compared to calcium carbonate. The response differences over time between the calcium supplements were statistically significant (p=0.03, supplement by hour interaction). b Symbols and lines represent individual subjects. Solid bars indicate the mean ΔAUC of each phase