
FIGURE 2.
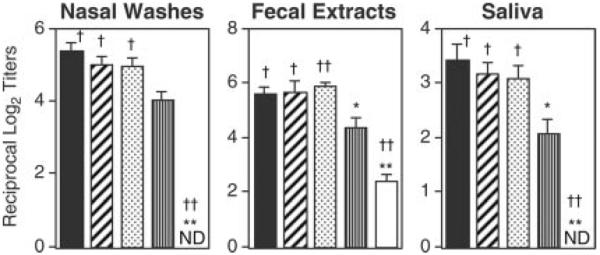
Comparison of OVA-specific IgA Ab responses in nasal washes, fecal extracts, and saliva of mice immunized with OVA plus nCT, mCT, or dmCTs. Each mouse group was nasally immunized once a week for three consecutive weeks with 100 μg of OVA plus 0.5 μg of nCT (■), dmCT E112K/KDEV (▨), dmCT E112K/KDGL ( ), mCT E112K (▥), or PBS (□) as mucosal adjuvant. Seven days after the last immunization, the IgA levels in nasal washes and saliva were determined by an OVA-specific ELISA. The values shown are the mean ± 1 SEM for 30 mice in each experimental group. ND indicates that the titer was not detectable. *, p < 0.05; **, p < 0.01, when compared with nCT; †, p < 0.05; ††, p < 0.01, when compared with mCT E112K.