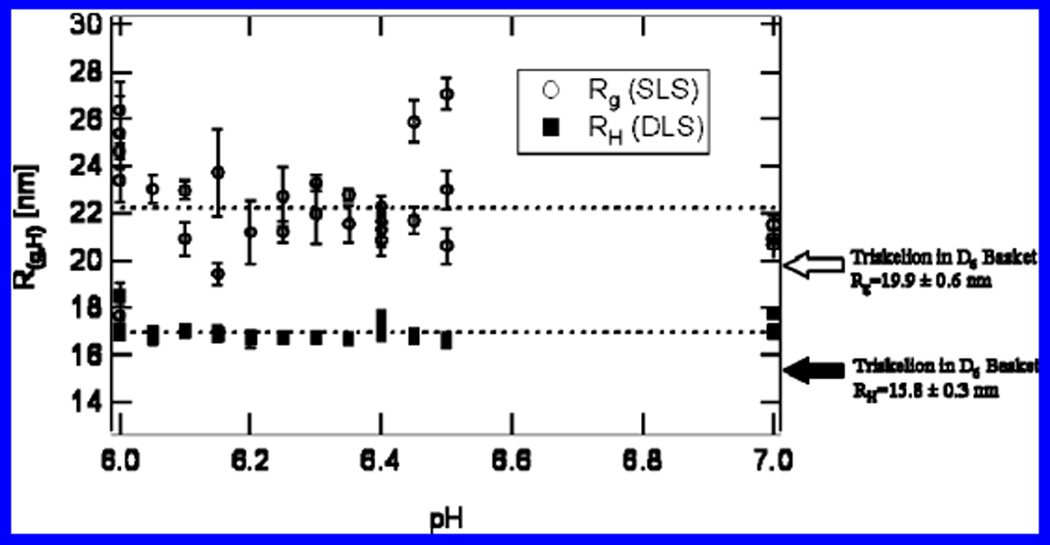
Figure 3.
Rg and RH of free clathrin triskelia measured by SLS and DLS. The abscissa indicates the pH of the buffered solution. Both measurements appear to be independent of pH. The arrows point to the values calculated by ZENO (13, 16) for the triskelial structure noted for clathrin in an assembled basket (8). Each data point was taken on a different sample. Error bars represent standard deviations of four measurements on the same sample.

