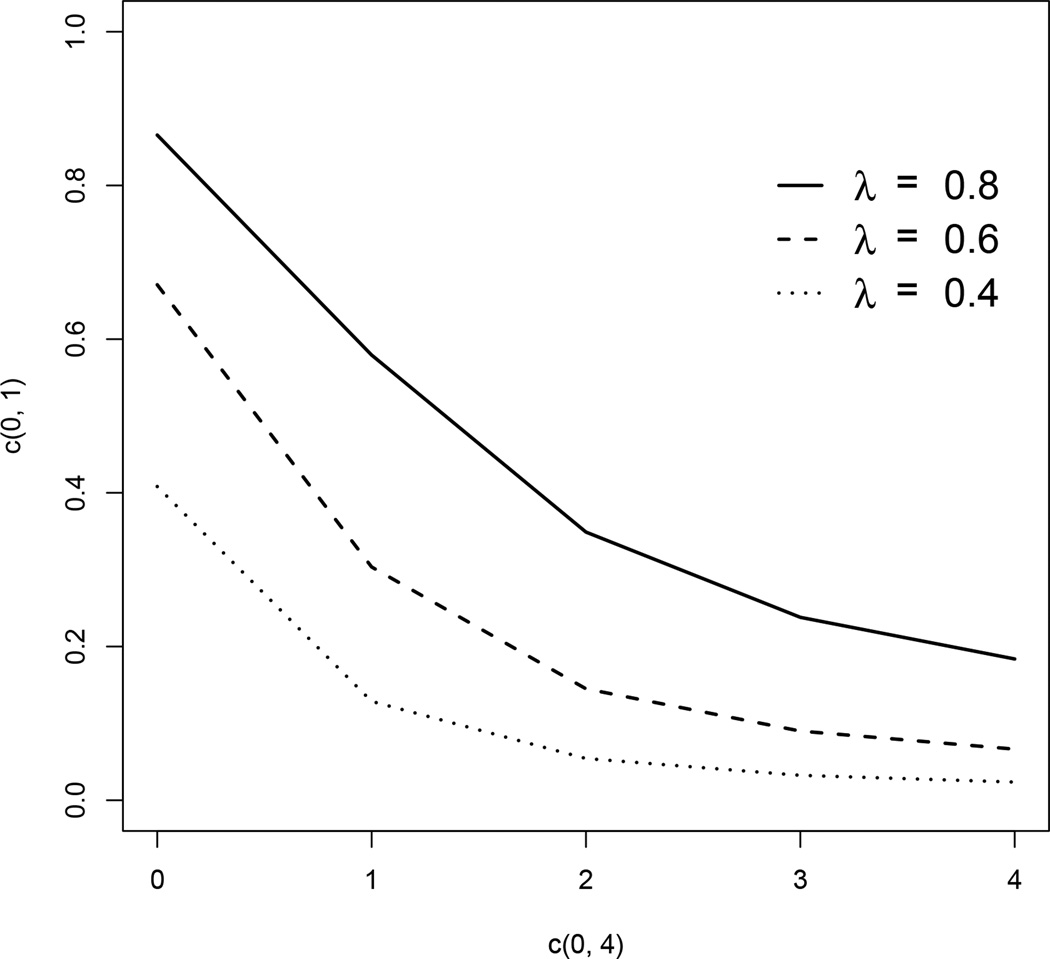
Figure 9.
Intercorrelation Between Increasing Derivative Orders
Note. Expected inter-derivative correlations for the zeroth through fourth item-level derivatives. Expected data generated from Simulation 1 condition with five timepoints, one common factor with an autoregression of 0.8, and factor loadings of 0.4, 0.6 and 0.8 constant across all items. Neither the sample size nor the number of items affect the expected correlation between like-orders of item-level derivatives.

