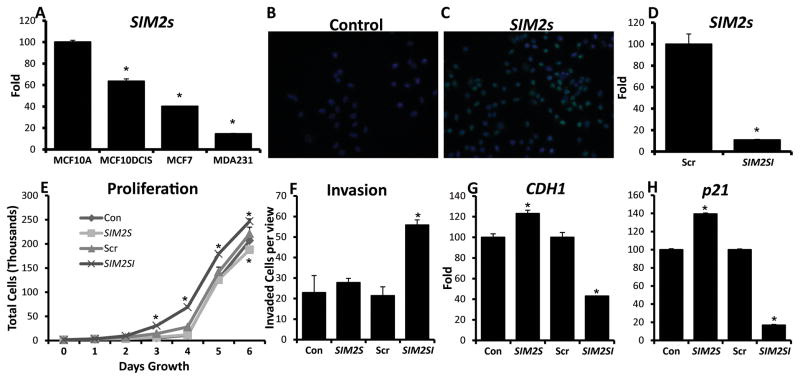
Figure 2. Analysis of MCF10DCIS cell transductions in vitro show changes in proliferation, invasion, and differentiation markers.
A – Q-PCR analysis of SIM2s mRNA levels in MCF10DCIS.COM and parent MCF10A cells, as well as commonly used breast cancer cell lines MCF7 and MDA.MB.231. B, C - Immunofluorescent staining of SIM2s to confirm nuclear SIM2s overexpression. D – Q-PCR analysis of SIM2s in the MCF10DCIS.com cell line confirming an approximate 80% loss of expression in adhered SIM2si cells. E – Proliferation assays confirm that SIM2s expression inhibits breast cancer cell proliferation, while loss of SIM2s increases growth. The values shown are the mean ± SE of triplicate samples. F - Boyden chamber invasion assay shows significantly more SIM2si cells were able to invade and migrate compared to controls. Values are the average number of cells per five fields per membrane of three separate plates. G & H - Q-PCR analysis of differentiation markers CDH1 and p21. * = p-value < .05.

