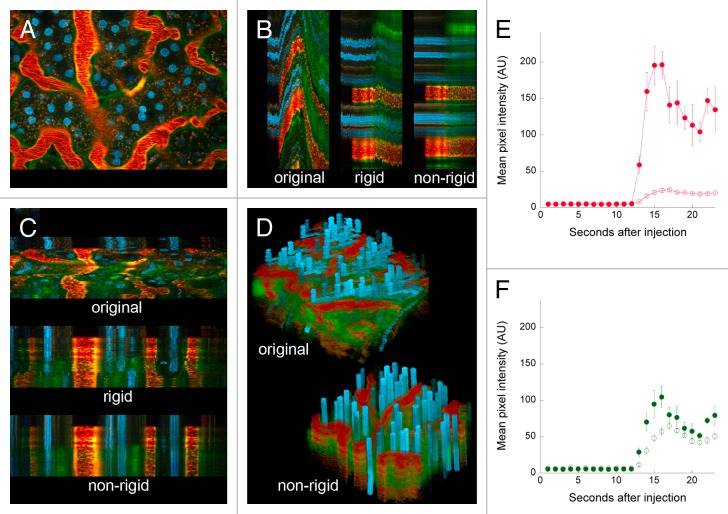
Figure 3. Digital correction of rigid and non-rigid motion artifacts in a time series of images collected from the kidney of a living rat. (A) First of 68 images collected from the kidney of a living rat, following intravenous injection of Hoechst 33342, 500 000 MW TexasRed-dextran and 3000 MW fluorescein dextran. (B) YT projection of the region identified by the vertical line in Panel A, before and after rigid and non-rigid registration. (C) XT projection of the region identified by the horizontal line in Panel A, before and after rigid and non-rigid registration. (D) Volume rendering of XYT volume before and after non-rigid registration. Image field is 195 microns across. The time series of the original and corrected image are presented in Video S3. (E) Graphs of mean intensity (± SE) of the 500 000 MW red dextran in 5 regions of the interstitium (open circles) or 5 regions in the lumen of adjacent capillaries (closed circles). (F) Graphs of mean intensity (± SE) of the 3000 MW green dextran in 5 regions of the interstitium (open circles) or 5 regions in the lumen of adjacent capillaries (closed circles).

An official website of the United States government
Here's how you know
Official websites use .gov
A
.gov website belongs to an official
government organization in the United States.
Secure .gov websites use HTTPS
A lock (
) or https:// means you've safely
connected to the .gov website. Share sensitive
information only on official, secure websites.
