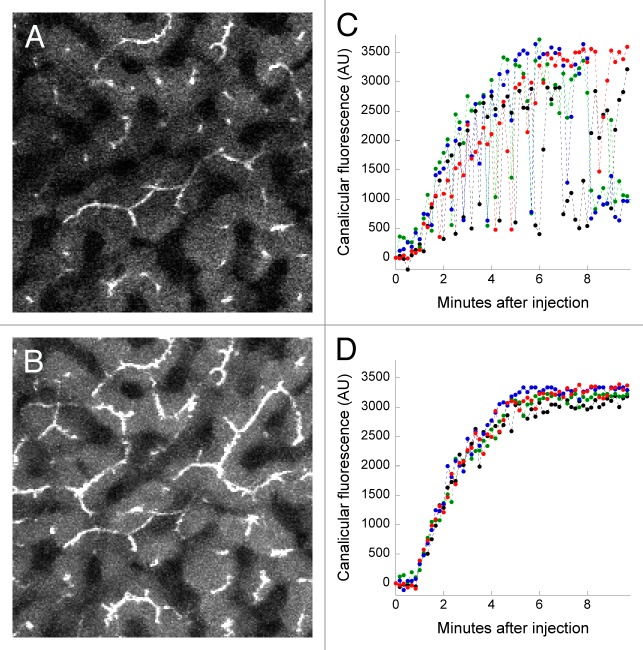
Figure 5. Accommodating axial motion by collection of image stacks. (A) A single multiphoton fluorescence microscopy image collected from the liver of a living rat five minutes after intravenous injection of sodium fluorescein. (B) A maximum-intensity projection of a six-plane image volume collected at the same time point as that shown in Panel A. Image field is 383 microns across. (C) Graph of the mean fluorescence quantified in regions of interest (10 pixel lines) located over 4 canaliculi, measured in a series of images collected from a single focal plane. (D) As in Panel C, but measured from a series of maximum-intensity projection images of volumes collected over time. Lateral motion of this time series was minimal and thus did not require IMART correction.

An official website of the United States government
Here's how you know
Official websites use .gov
A
.gov website belongs to an official
government organization in the United States.
Secure .gov websites use HTTPS
A lock (
) or https:// means you've safely
connected to the .gov website. Share sensitive
information only on official, secure websites.
