
. 2015 Jun 17;8:243. doi: 10.1186/s13104-015-1175-z
© Heinz and Rollnik 2015
Open AccessThis article is distributed under the terms of the Creative Commons Attribution 4.0 International License (http://creativecommons.org/licenses/by/4.0/), which permits unrestricted use, distribution, and reproduction in any medium, provided you give appropriate credit to the original author(s) and the source, provide a link to the Creative Commons license, and indicate if changes were made. The Creative Commons Public Domain Dedication waiver (http://creativecommons.org/publicdomain/zero/1.0/) applies to the data made available in this article, unless otherwise stated.
Figure 4.
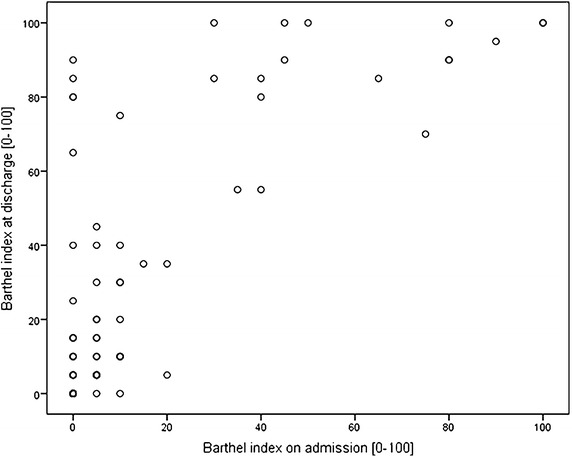
Scatter plot showing Barthel Index (BI) on admission and at discharge (r = 0.759, p < 0.001).