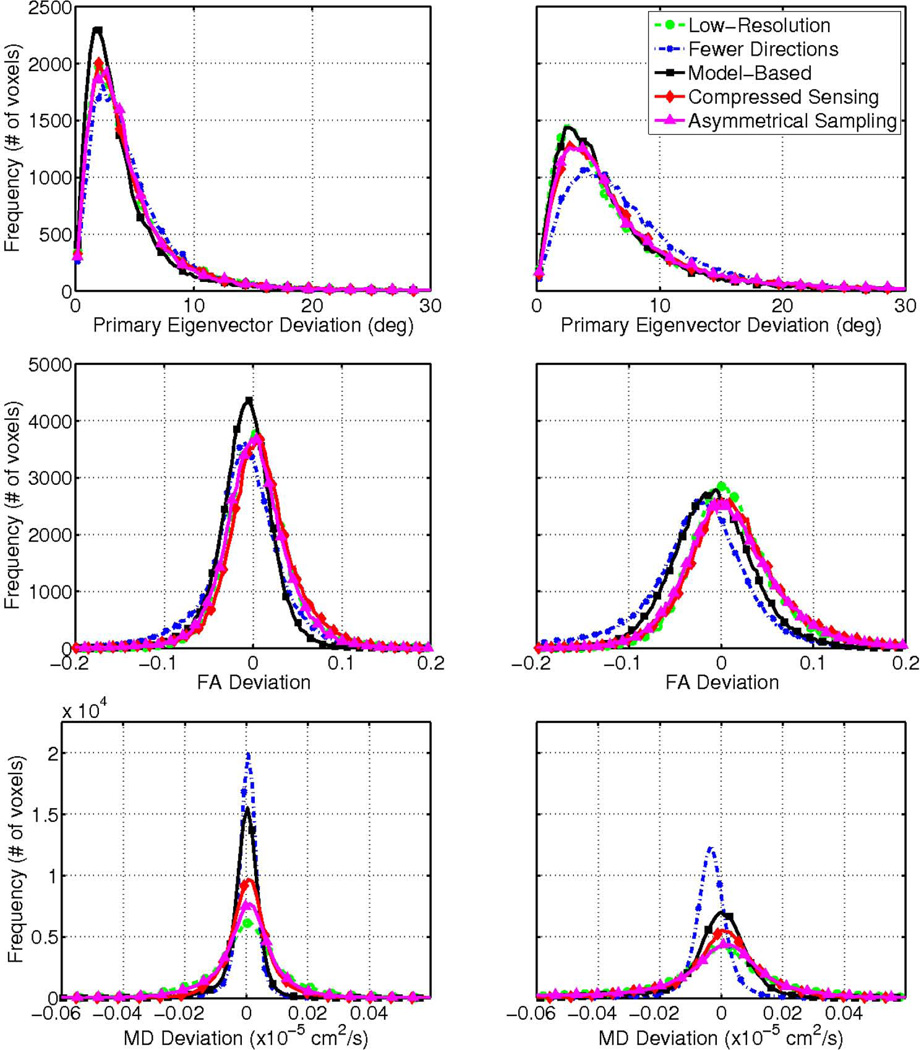
Figure 6.
Distribution of primary eigenvector (top row), FA (middle row) and mean diffusivity deviation (bottom row) for 50% (left) and 75% (right) undersampling for the same test dataset shown in Figs. 4 and 5. The model-based approach (solid squares) was compared against compressed sensing (solid diamonds) and asymmetrical reconstructions (solid triangles) and comparable low-resolution (dashed circles) and fewer-direction (dash dot x’s) cases. The bias in FA deviation (e.g., in the fewer directions case for R = 4) indicates that the FA was underestimated as compared to the gold standard.

