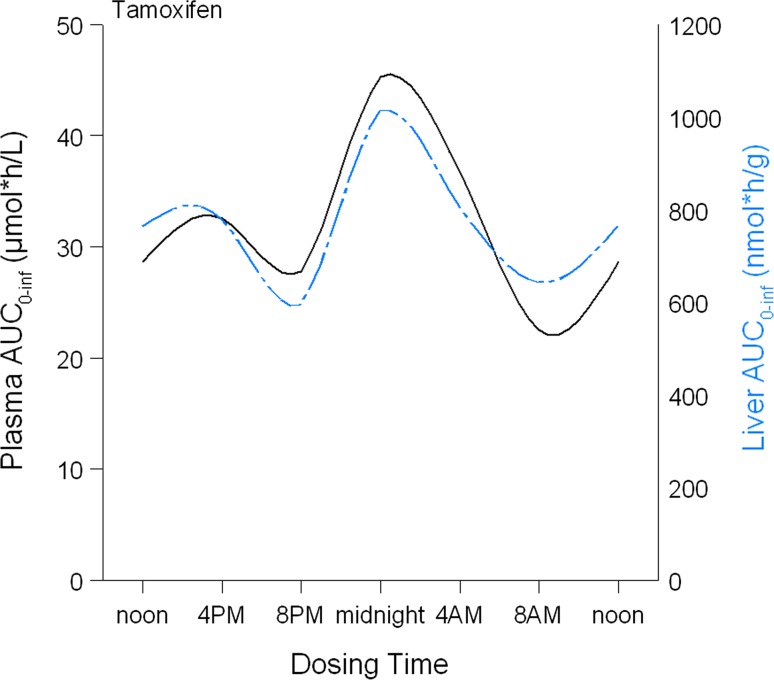
Fig. 2.
Exposure to tamoxifen (AUC0–last) in plasma and liver tissue of mice following tamoxifen administration at six different times. Tamoxifen was administered to 18 mice at six different time points. Blood was collected at six time points (3 mice/time point) after tamoxifen administration and area under the curves (AUCs0–last) was calculated. Data are presented as AUC0–inf (y-axis), derived from non-compartmental analysis on plasma concentration–time profiles of tamoxifen following dosing at six different times in a 24-h period (x-axis)

