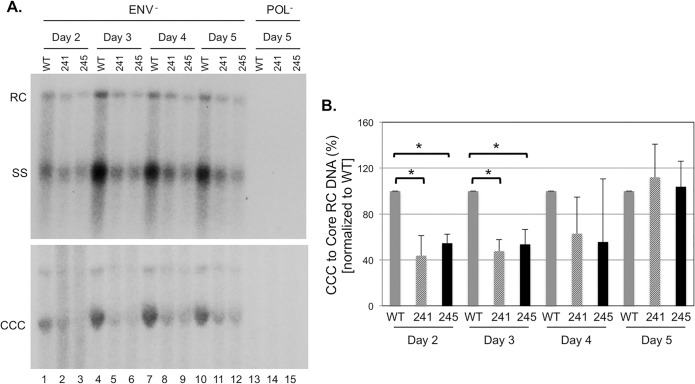
Fig 5. Tdp2 knockout modestly suppressed DHBV CCC DNA formation in HepG2 cells.
HepG2 cells, with (241, lanes 2, 5, 8, 11, 14; 245, lanes 3, 6, 9, 12, 15) or without (WT, lanes 1, 4, 7, 10, 13) Tdp2 knockout, were transfected with the envelope-defective DHBV replication plasmid (lanes 1–12), or the polymerase-defective DHBV plasmid as a negative control (lanes 13–15). On the indicated days post-transfection the cells were harvested and analyzed for protein expression and viral DNA levels. A. DHBV core (top) and PF DNA (bottom) levels analyzed by Southern blot analysis. B. Levels of DHBV CCC DNA on the indicated days post-transfection were normalized to those of the core RC DNA and the ratios of CCC/core RC DNA in the Tdp2 KO cells were compared to those in the WT cells, which were set at 100. The asterisks (*) in B indicate statistically significant differences (P < 0.05; unpaired, two-tailed t-test). CCC, CCC DNA; RC, RC DNA; SS, single-stranded DNA [full-length (-) strand].

