


Fig. 1.
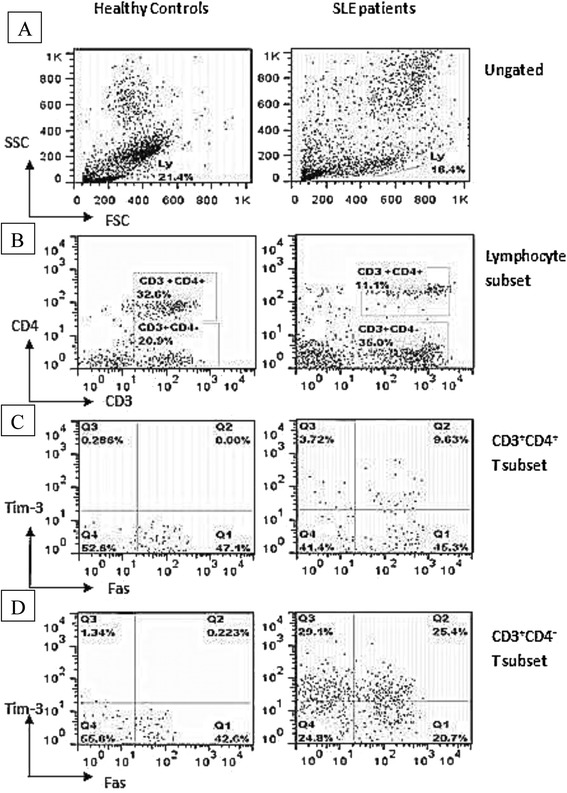
Fluorescence-activated cell sorting to quantify lymphocyte subsets from patients with SLE and healthy controls (HCs). Peripheral blood mononuclear cells from HC (left panels) and patients (right panels) were sorted to reveal proportions of (a) lymphocytes in the total cell population, (b) CD3+CD4+ and CD3+CD4- T subsets among all lymphocytes, (c) Tim+ and Fas+ subsets among CD3+CD4+ lymphocytes and (d) Tim+ and Fas+ subsets among CD3+CD4- lymphocytes