Fig. 3.
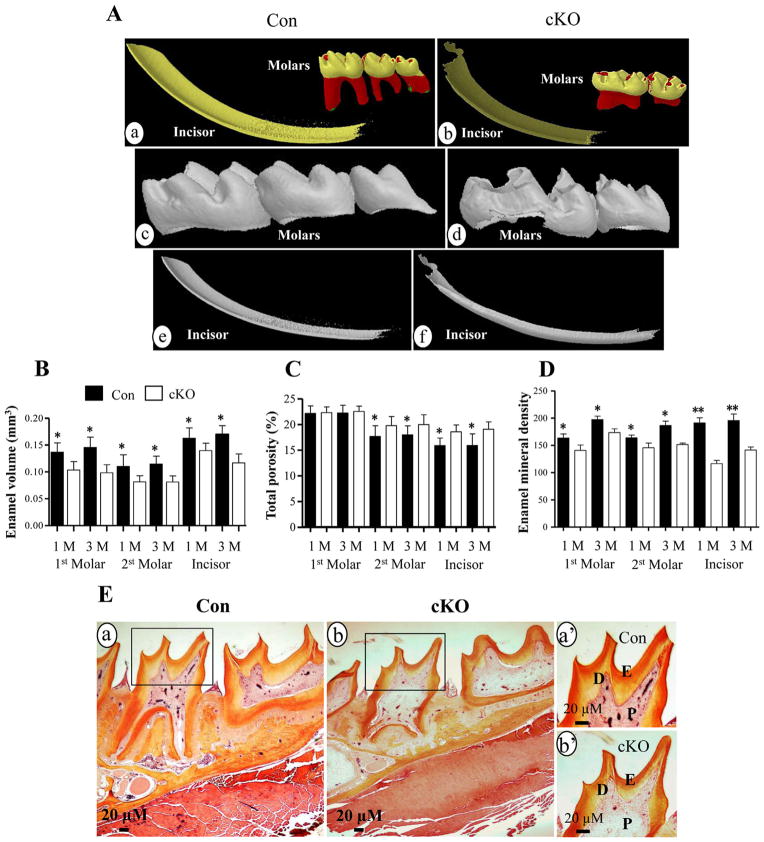
Micro-computer tomography and histology of teeth. A. Micro-CT analysis of teeth of the Bmp2 cKO (b, d, f) and control (a, c, e) mice. The molars (a, b, c, d) and incisors (a, b, e, f) from 1 month old mice were subjected to Micro-CT analysis and showed that enamel layer in the null mice is thinner than that of the control mice. Mineral density of the incisors and molars of the Bmp2 cKO mice is decreased versus the control groups. The third molar of the null mice is missing. B. Enamel volume of the first, second molars and incisors in the null mice is reduced in the 1- and 3-month-old mice. C. Porosity of the second molars and incisors of the Bmp2 mutant mice is increased in size. D. Enamel mineral density of the first, second molars and incisors is decreased in the 1- and 3-month-old cKO mice. E is representative images, and histological staining showed that enamel layer and dentin of the molars are thinner (b) than the control teeth (a) in 1 mouth-old mice. a′ and b′ show higher magnification of a and b. *(P <0.05) and **(P <0.01) indicate significant differences between the control and Bmp2 cKO groups. Con, control; cKO, Bmp2 conditional knock out; D, dentin; E, enamel; P, dental pulp. Yellow and red colors of molars in panels Aa and Ab show tooth crown and root, respectively. Dark and light yellow colors of incisors in panels Aa and Ab indicate enamel and dentin.

