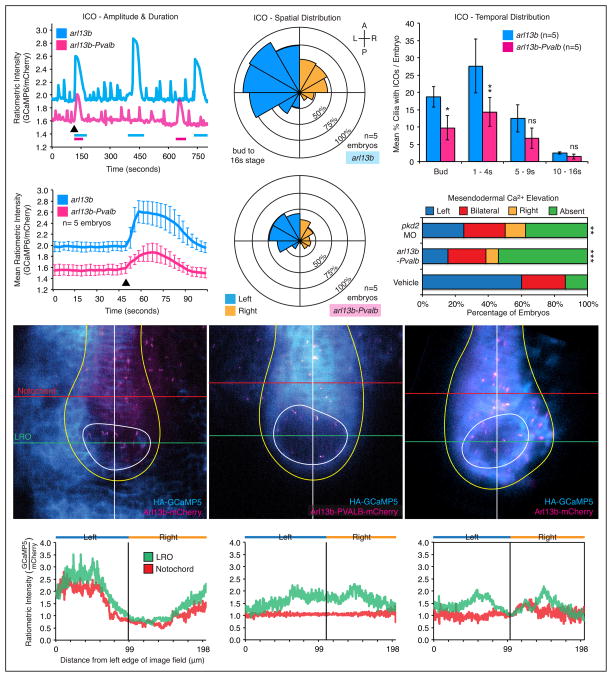
Figure 4. ICOs are required for establishing asymmetric mesendodermal calcium at the LRO.
A–D. Suppression of ICOs by arl13b-Pvalb. (A–B) Ratiometric intensity (arl13b-GCaMP6/mCherry) over time plot of a single cilium from a representative embryo (A) or a mean trace representing five embryos (B) exhibiting ICOs in arl13b (cyan) and arl13b-Pvalb (magenta) LROs at the 1–4 somite stage. Each plot was aligned post-acquisition to the first detected ICOs (indicated by black arrowhead) and thresholded to facilitate analysis of calcium oscillation dynamics. (C) Rose diagrams depicting the spatial distribution and mean percentage of cells per embryo displaying ICOs in the total LRO of arl13b (upper) and arl13b-Pvalb (lower) embryos spanning the entire course of LRO development (bud to 16-somite stage). Rings correlate with mean percentage of cells exhibiting calcium oscillations per embryo from bud to 16-somite stage (n = 5 embryos at all stages for arl13b and arl13b-Pvalb). Control and experimental samples were acquired in a pair-wise manner and analysis was performed on time-lapse recordings spanning bud to 16-somite stage. Left-sided calcium, blue. Right-sided calcium, orange. (D) Temporal mapping of mean percentage of cells exhibiting ICOs per embryo in the entire LRO in arl13b (cyan) and arl13b-Pvalb (magenta) embryos across the entire course of LRO development (bud to 16-somite). Data is shown as mean±SEM. E–G. Disruption of mesendodermal calcium by arl13b-Pvalb. (E) Distribution of vehicle, arl13b-Pvalb and pkd2 MO embryos with normal left, or abnormal right, bilateral and absent mesendodermal calcium signal at the LRO. pkd2: **P=0.0033; arl13b-Pvalb: ***P=0.0002. (F) Representative live fluorescent images depicting cytoplasmic calcium in mesendodermal cells of vehicle, arl13b-Pvalb-mCherry and pkd2 MO zebrafish embryos at the 6 to 8-somite stage. Calcium is visualized with HA-GCaMP5 (cyan) and cilia are identified by Arl13b-mCherry (magenta). Scalebars = 30 μm. A: Anterior, P: Posterior, L: Left, R: Right. (G) Ratiometric intensity plot (GCaMP5/mCherry) of cytoplasmic mesendodermal calcium levels corresponding to images in F, relative to position at the LRO level (green) and posterior notochord level (red) across the left-right axis. See also Figures S5, and Movies 4–6.

