
Figure 1. Mice Exhibit Four Gaits.
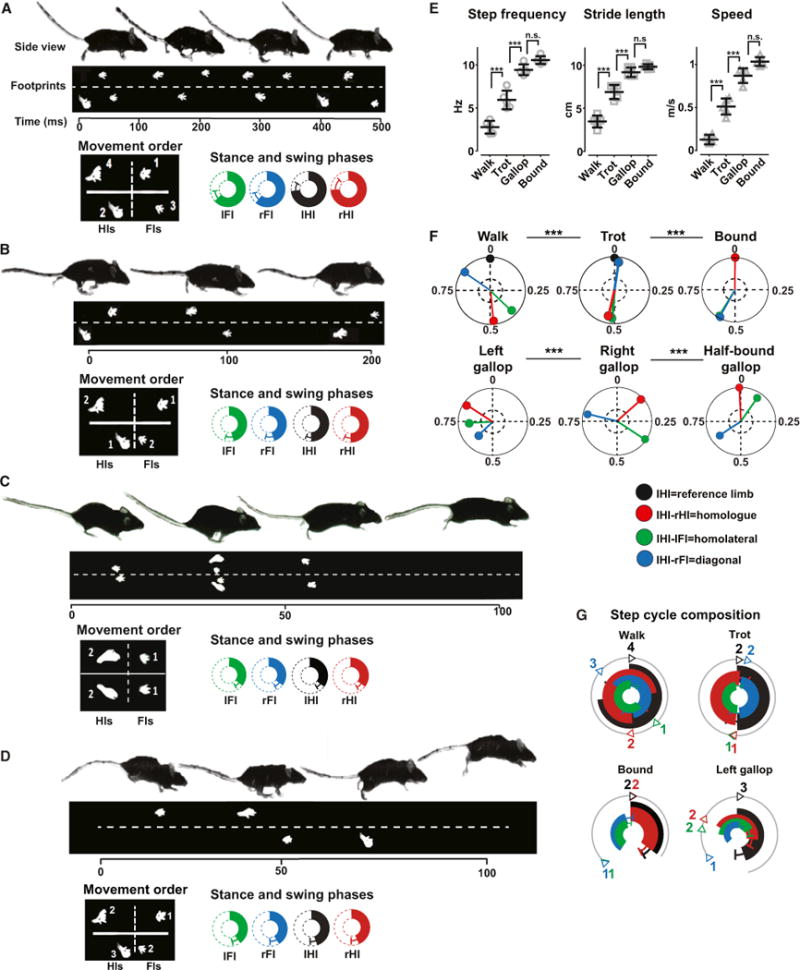
(A–D) Side views of mice showing a sequence of walk (A), trot (B), bound (C), and gallop (D) with indication of footprints of the hind- and the forelimbs below. The scale bars give time in ms. The square box in the bottom panel to the left indicates the order of the movements of the feet (Fls, forelimbs; Hls, hindlimbs). The circular plots below show the duration of the stance phase (filled bars) and swing phases (open bars), in percent of a normalized step cycle (mean ± SD). IFI, left forelimb, green; IHI, left hindlimb, black; rFI, right forelimb, blue; rHI, right hindlimb, red.
(E) Mean (±SD) step frequency (walk [Hz]: 2.7 ± 0.7; trot: 5.9 ± 1.0; gallop: 9.8 ± 0.7; bound: 10 ± 0.4), stride length (walk [cm]: 3.4 ± 0.6; trot: 6.8 ± 0.8; gallop: 9.1 ± 0.5; bound: 9.8 ± 0.2), and speed (walk [m/s]: 0.09 ± 0.05; trot: 0.51 ± 0.09; gallop: 0.91 ± 0.8; bound: 1.0 ±0.05) for walk, trot, gallop, and bound (number of steps: walk, n = 66; trot, n = 174; gallop, n = 61; bound, n = 26). The mean for individual mice (n = 5) are represented in the graph by single points in each category.
(F) Circular plots with the mean phase values between the IHI, the reference (black vector: phase value equals 0) and the right hindlimb (IHI-rHI; red vector), left forelimb (IHI-IFI; green vector), and the right forelimb (IHI-rFI; blue vector) for walk, trot, bound, and the different types of gallop. Gallop was sorted using the leading hindlimb into right and left gallop (right gallop: n = 11; left gallop: n = 40) and half-bound gallop (n = 10). Phase values of 0.5 correspond to strict alternation, whereas phase values of 0 or 1 correspond to strict synchrony. The length of the vector indicated the concentration of phase values around the mean. The dotted inner circles represent a significance level of p = 0.05. The limb coordination was significantly different during the different types of gallop (Watson and William’s test; p < 0.05).
(G) Circular bar graphs of the stance phase in normalized step cycles during walk, trot, bound, and gallop. The mean phase values (obtained from values in F) set the onsets of the stance phases, and the duration of individual stance phases are obtained from data presented in the plots in the lower panel in (A), with specific color codes for the individual legs. The circular bar graphs only show the stance phase of the individual legs. The numbers correspond to order of movements of the feet (see A and B).
See also Figure S1 and Movies S1, S2, S3, and S4.