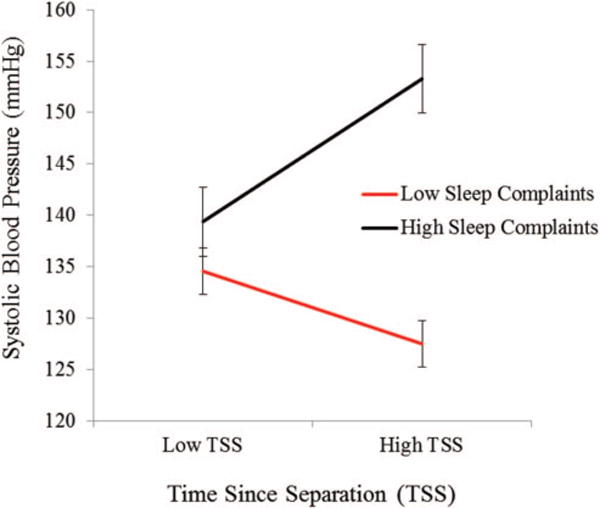
Figure 2.

Systolic blood pressure (SBP) at V2 as a function time since separation (TSS) in weeks and PSQI sleep complaints at V1. The figure illustrates the combined effects of TSS and sleep complaints on SBP 3 months later for people who are ±1 SD above/below the mean on both the continuous predictor variables.
