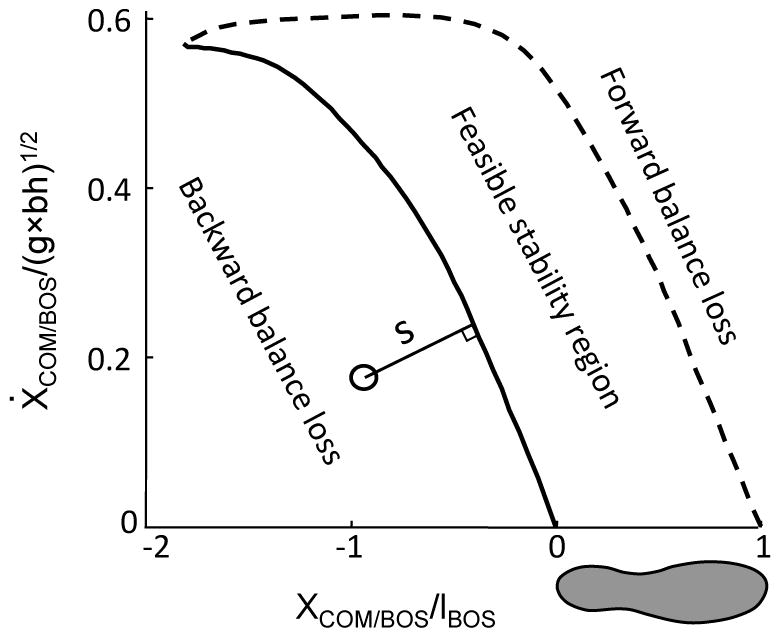
Fig. 1.

Schematic illustration of the feasible-stability-region (FSR) measurement (s). The thin solid line indicates the magnitude of the FSR measurement against backward balance loss, which was defined as the shortest distance from the given center of mass (COM) motion state (i.e., the combination of the COM anteroposterior position and forward velocity) to the limits against backward balance loss (the thick solid line). When the COM motion state is below/above the limits, the FSR measurement value is negative/positive, respectively. Also shown is the computer predicted FSR in the COM motion state space. The FSR is enclosed by two boundaries: the limits against backward balance loss and the one against forward balance loss (the thick dashed line). Position (XCOM/BOS) and velocity (ẊCOM/BOS) of the COM relative to the base of support (BOS) are dimensionless variables expressed as a fraction of lBOS and , respectively, where lBOS depicts the foot length, g is gravitational acceleration, and bh the body height.
