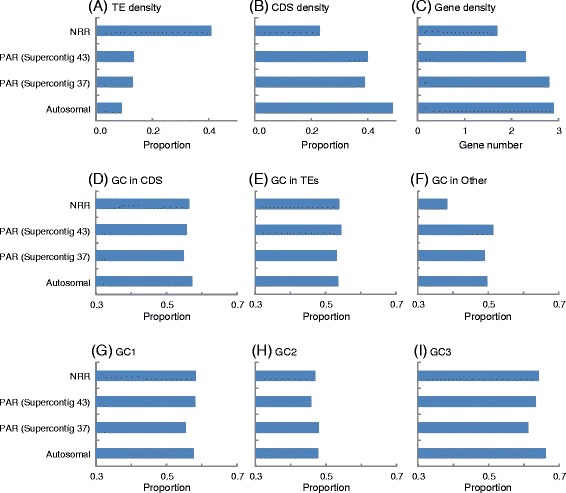
Fig. 2.

Comparisons of sequence characteristics in non-recombining regions (NRR) of the mating-type chromosome, pseudoautosomal regions (PAR), and autosomes. The genomic regions are shown, with results for the two supercontigs (“37” and “43”) corresponding to the two PARs presented separately. a Transposable element (TE) density is shown as the total length of TE sequences over the total length of DNA analyzed. b, c Gene density is shown as the proportion of the total length of coding region (CDS) over the total length of DNA analyzed, and number of putative genes identified per 10000 nucleotides, respectively. d–f Proportion GC base pair contents are shown for CDS, TEs, and for the remaining, predominantly intergenic regions. g–i Proportion GC base pair content for protein-coding genes are shown relative to first-, second-, and third-codon positions (“GC1”, “GC2” and “GC3,” respectively)
