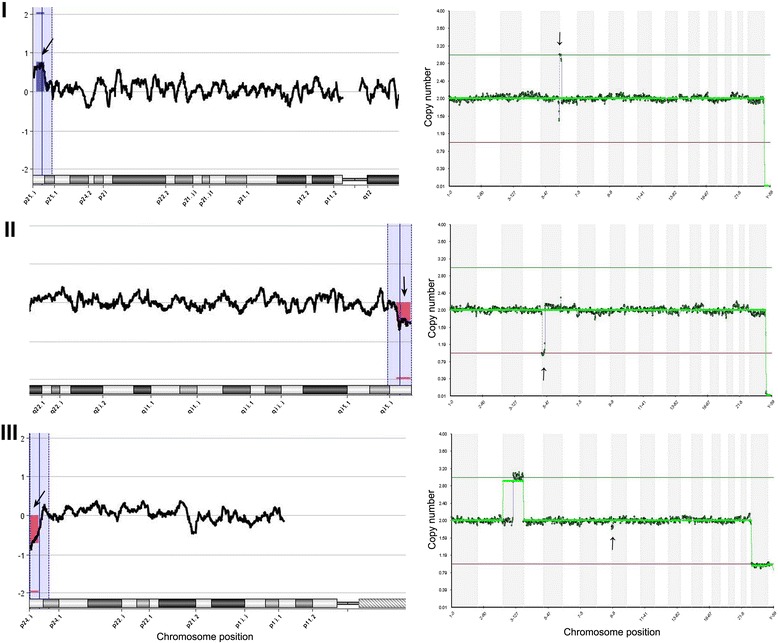
Fig. 2.

Examples of segmental imbalance detection selected from Coriell cell lines by next-generation sequencing (right panel) compared with array comparative genomic hybridization (left panel). Arrows in the right panel indicate locations of partial chromosomal imbalances. Blue and red boxes (indicated by arrows) in the left panel indicate same partial chromosomal imbalances (duplication or deletion), respectively. Only abnormal chromosomal segment (not all 24 chromosomes) are showed in the left panel. (I) Top left and right charts show a sample with a 2.19-Mb segmental duplication on the short arm of chromosome 6 from sample #5 in Table 3. (II) Middle left and right charts show a sample with a 2.53-Mb segmental deletion on the long arm of chromosome 5 from sample #2 in Table 3. (III) Bottom left and right charts show a sample with a 1.81-Mb segmental deletion on the short arm of chromosome 9 from sample #3 in Table 3
