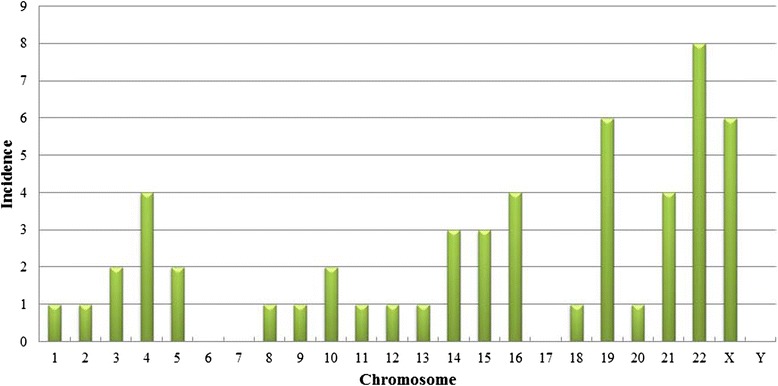
Fig. 3.

Incidence of the errors of individual chromosomes. The x-axis indicates the chromosome number, and the y-axis indicates the incidence of the chromosome errors. The abnormalities occurred to almost all chromosomes, except chromosome 6, 7, 17 and Y chromosome
