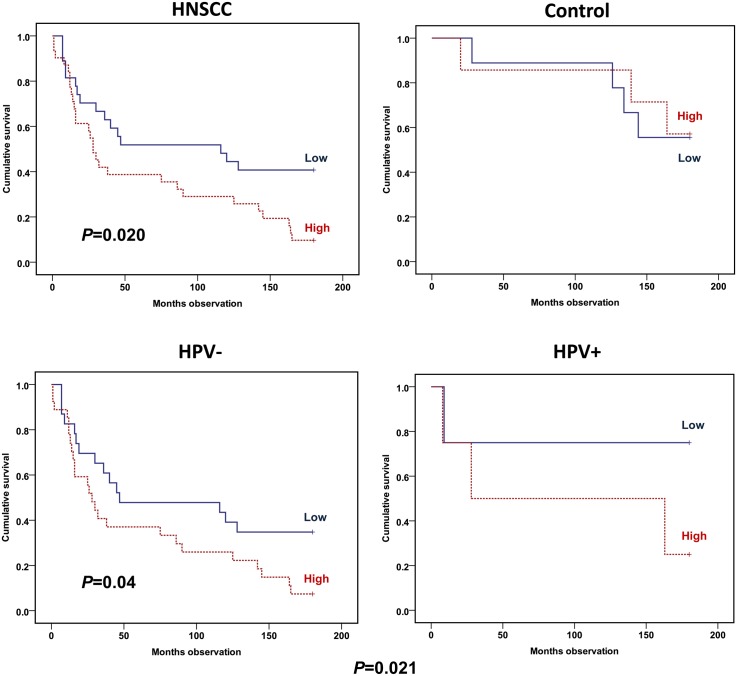
Fig 3. Overall survival plots dependent on percentage CD71 expression on T lymphocytes (CD3-positive cells).
HNSCC versus control patients (upper panel) and HNSCC patients adjusted by whether HPV infected the tumor (lower panel). Percentages determined by flow cytometry on fresh PBMCs harvested from the patients. Percentages dichotomized by median value to low (continuous line) or high (hatched line). Cohort (upper panel): 58 HNSCC and 16 control patients. Cohort (lower panel): 50 HPV-negative and 8 HPV-positive. Statistics by Kaplan-Meier analyses (Log rank test).

