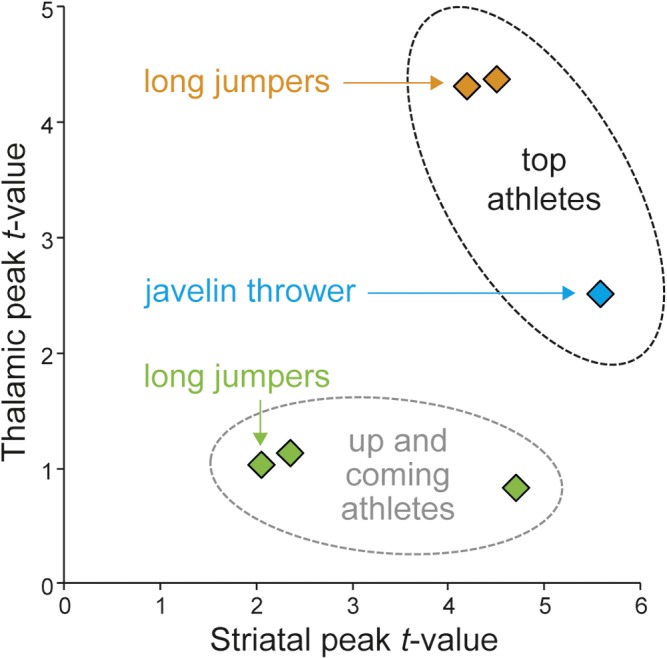
Fig 3. Characteristic structural features in the thalamus and striatum.

The x- and y-axes show maximum t-values of structural differences in the striatum and thalamus for the three top athletes and the three up-and-coming athletes as compared to their controls.
