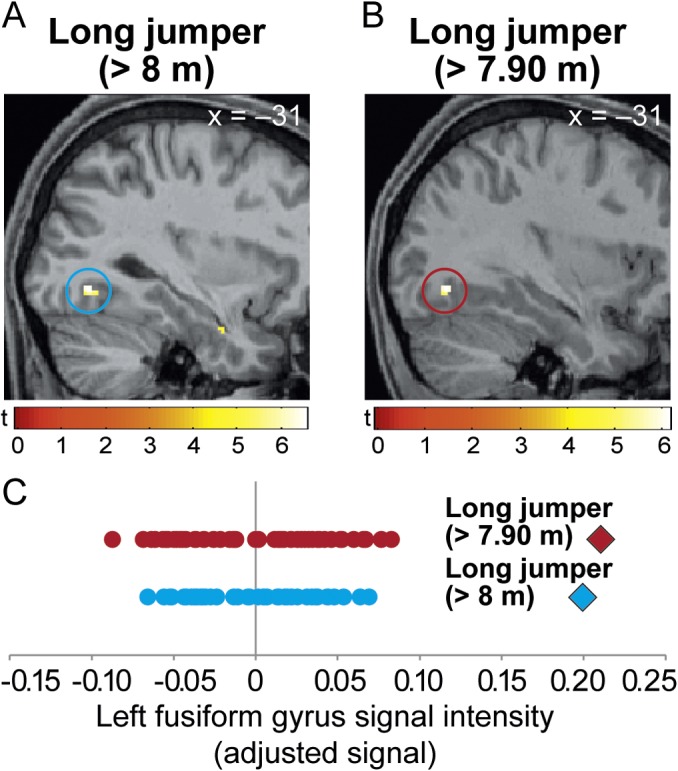
Fig 4. Whole-brain analysis.

Significantly larger regional GMD in the left fusiform gyrus (blue and brown circles) in each of the two top long jumpers as compared to controls (for A: t = 6.58; x y z coordinate: -32, -70, -8 and for B: t = 6.15; x y z coordinate: -32, -72, -8). The bars show t-values. GMD differences were not observed in the top javelin thrower or the three up-and-coming long jumpers. (C) Variations in fusiform gyrus signal intensity for each athlete (icon) and their control group (dots). Each of the two rows of dots corresponds to a case-control comparison: blue = A; brown = B. Values were derived from individual peak coordinates in the fusiform gyrus (A and B).
