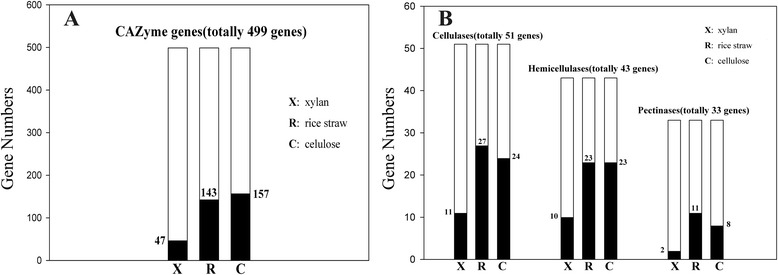
Fig. 9.

The conditions of degrading-enzyme gene expression. The whole histogram includes all genes in that group, and black indicates the genes that were significantly different in that treatment compared to sucrose. a CAZyme gene numbers with significantly different expression levels in xylan, rice straw and cellulose when compared to sucrose control. b Hydrolase genes with significantly different expression levels in xylan, rice straw and cellulose compared to sucrose
