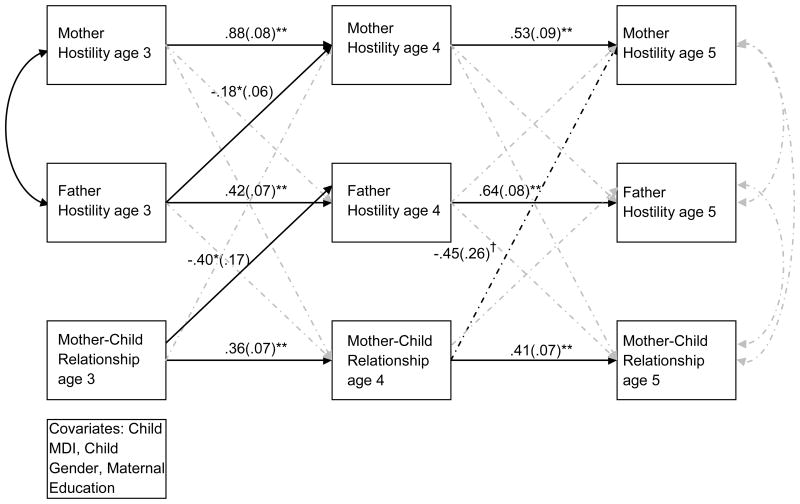
Figure 1.
Cross-lagged autoregressive model from child ages 3 to 5. Only significant path estimates are shown in figure for ease of readability. Numbers indicate raw path coefficients with standard errors in parenthesis. Solid lines indicate significant pathways, black dashed lines indicated marginally significant paths, and grey dashed lines indicate nonsignificant pathways. Direct paths were included from both covariates to all endogenous variables in the model, but are not shown. Model provides an adequate fit to the data: χ2 (20) = 44.46, p < .01; CFI = .95; RMSEA = .08; SRMR = .04. †p<09, *p<.05, **p<.001

