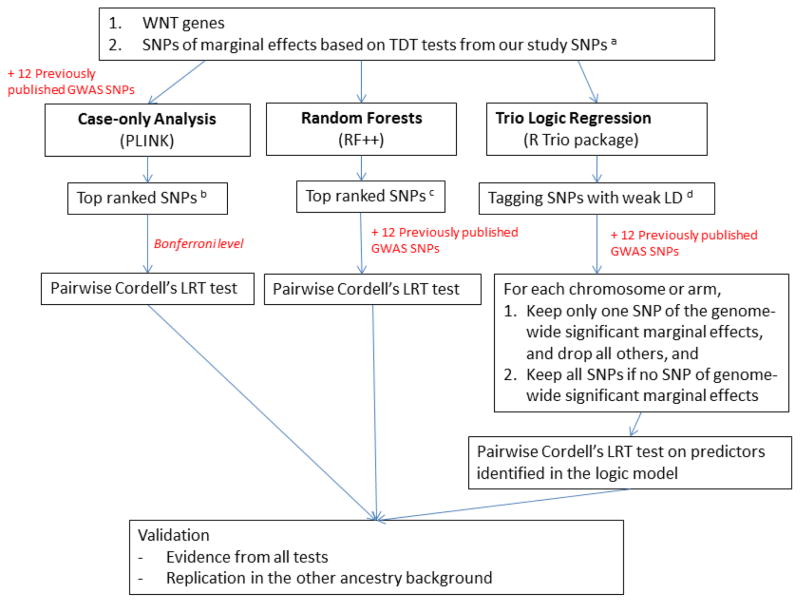
Figure 1. Flow chart of analytical methods for trio design.
a. The threshold was set as genotypic TDT p-values < 10−5.
b. The threshold was set as case-only test p-values < 10−4, excluding pairs in non-negligible LD (r2 < 0.01). The lists of selected SNPs were shown in supplementary table 5 and 6.
c. The threshold was set as the cut-point (“elbow”) along the curve for importance scores from all SNPs. The procedure proposed by Goldstein et al. [2010] is a heuristic approach to identify the top SNPs that have much higher importance scores than the rest. The lists of selected SNPs were shown in supplementary table 3 and 4.
d. The threshold of pairwise LD is set as r2< 0.1 to select the tagging SNPs.

