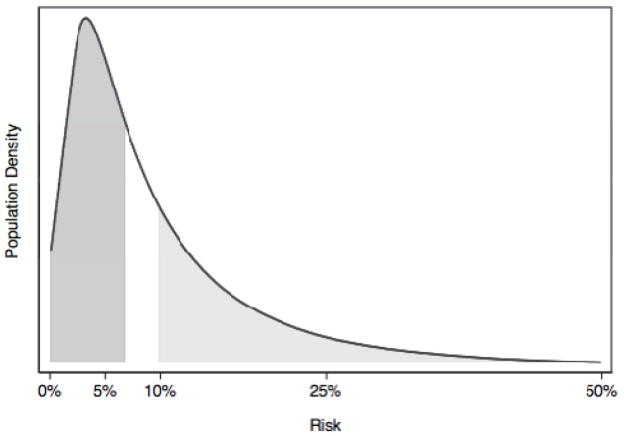
Figure.
The distribution of risk for a typical risk prediction model. The mean risk is 10%, the median risk is 7%. The dark grey area constitutes the 50% of patients with risk less than the median; the light grey represents the patients with risk greater than the mean, about a third. Approximately two-thirds of patients have risks less than the mean.

