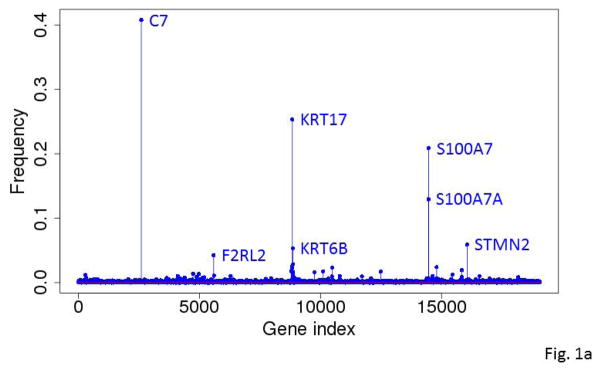
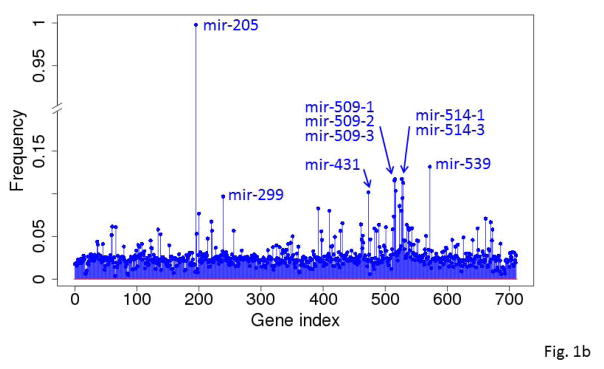
Figure 1.


Frequencies with which the genes (A) and miRNA (B) were selected into near-optimal feature sets among the 10,000 runs based on RNA-seq gene expression data. Each run selected 20 unique near-optimal genes. The frequency was computed based on how often a gene occurred in the 10,000 sets of 20 genes.
