Figure 5.
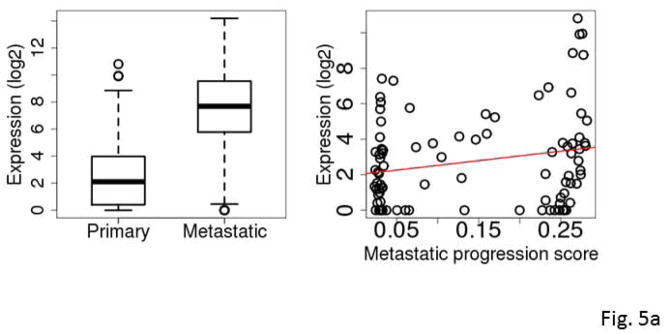
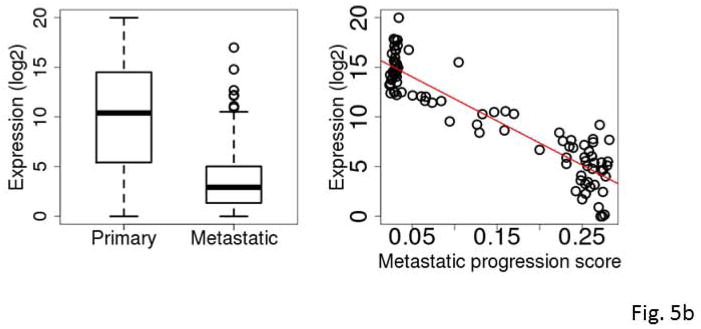
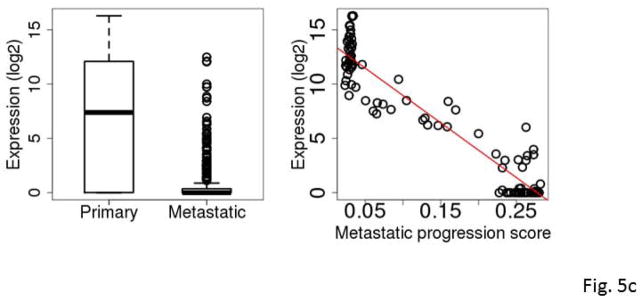
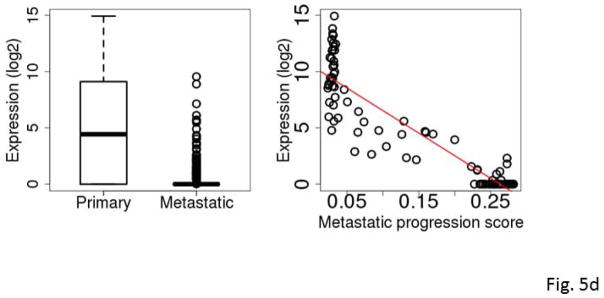
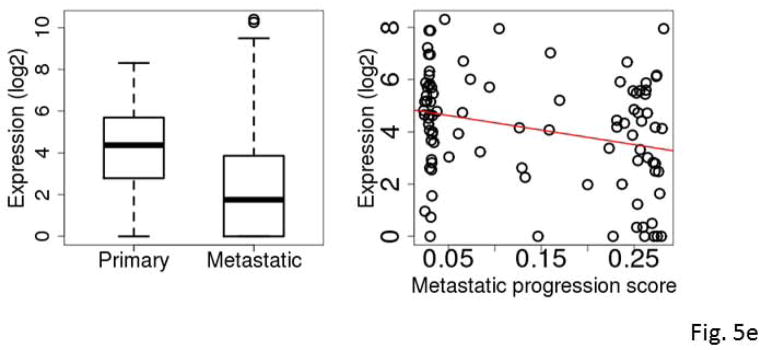
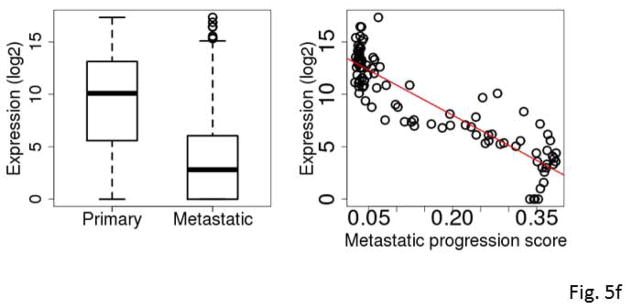
Box plots comparing expression levels in primary and metastatic tumors (left) and correlation between expression and metastatic progression score for clinically classified primary SKCM tumors (right). The gene expression levels were log2 transformed. C7 (A), KRT17 (B), S100A7 (C), S100A7A (D), STMN2 (E), and mir-205 (F).
