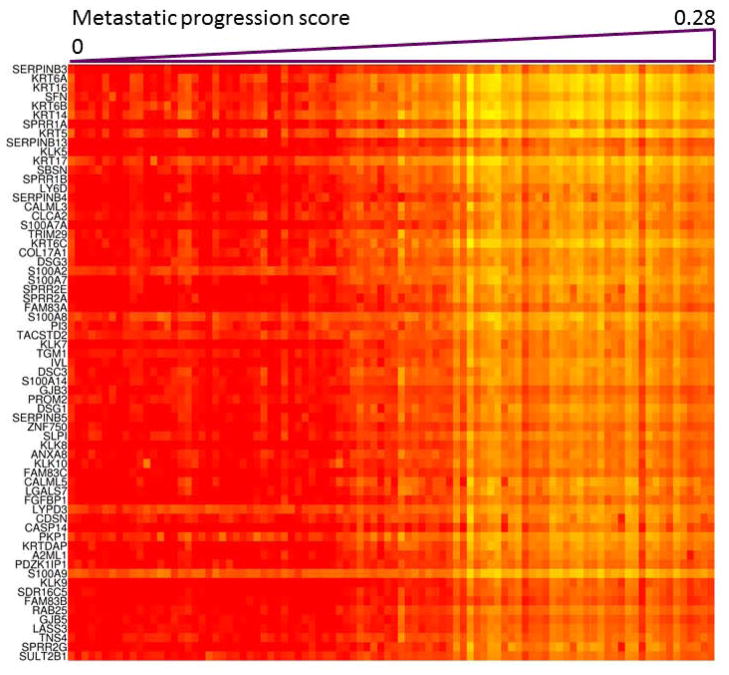
Figure 6.
Heat map display of the expression patterns of the top 65 genes (ρ<−0.7) with the highest negative correlation with metastatic progression score across the 94 primary SKCM tumors. No genes with high positive correlation (ρ>0.7) were found. The genes were arranged by the absolute correlation coefficient with the highest being at the top. For each gene, the Spearman correlation was computed by matching the expression levels of the gene in the 94 primary tumor samples and the predicted metastatic progression scores for the 94 primary tumors. The gene expression level was colored in red and yellow with red being the highest expression and yellow the lowest expression. The triangular bar at the top of the figure was drawn proportionally to the progression score. The primary tumor samples were arranged with the lowest score on the left and highest on the right. It can be seen that, for each gene, the tumor’s metastatic progression score is negatively correlated with the gene’s expression level.

