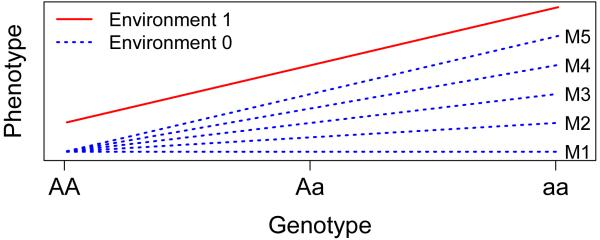
Figure 1.

A range of possible gene and gene-environment models, from M1 (complete interaction) to M5 (no interaction). The red line represents genotypic effect among individuals who have been exposed to the environmental insult. The 5 blue lines represent possible genotypic effects for individuals who were not exposed to the environmental insult, resulting in models that range from complete interaction (M1) to no interaction (M5).
